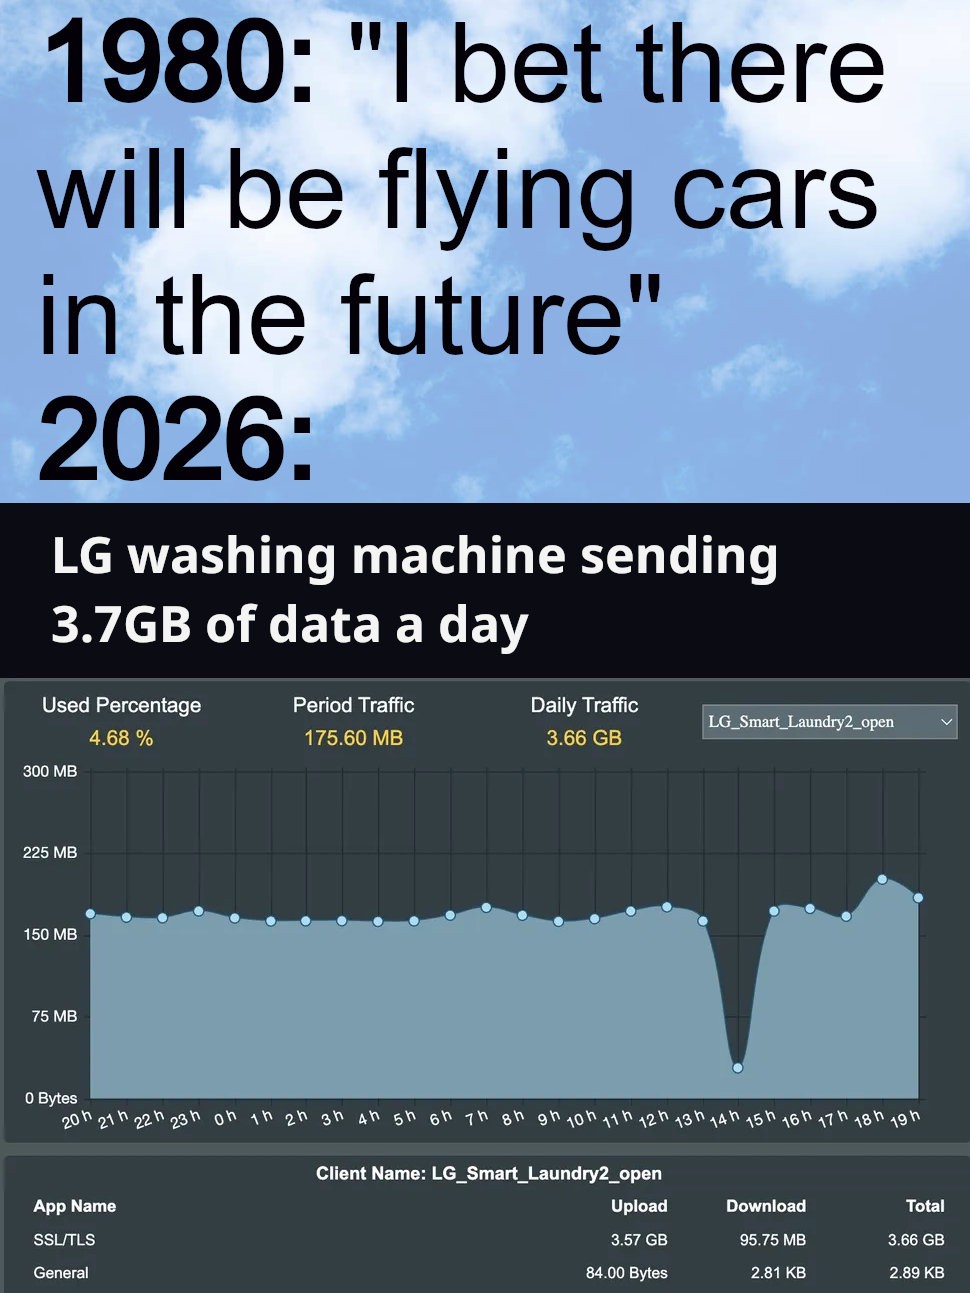
In 2024, a user noticed this odd traffic on their local network, took a screenshot of the graph, and posted it to Twitter
After discussing the issue with other Twitter users, the original poster realized that this graph was actually a mistake with their router or something. This reporting software was reporting some other device’s network traffic as being the washing machine’s traffic. The washing machine was actually only using a reasonable amount of data.
Despite this past revelation, in 2026, someone put together a “meme” of sorts comparing the supposed events in that 2024 graph to what people in the past had predicted the future to be.
For whatever reason, that “meme” was put through AI post-processing of some sort. Was the attempt to “upscale” this image after it had been passed around and been automatically compressed down by various platforms? Or was it someone using some newfangled AI-assisted compression technique in an attempt to create a smaller file size than any of the more traditional compression techniques? No idea. Whatever the reason was, the image was left with a bunch of nonsense text on the graph portion.
I saw this “meme” and decided to share it here without scrutinizing the text on the graph. As mentioned in my first point, this graph was originally posted years ago, so I was already familiar with it and did not feel the need to read into it in the image I was sharing. I felt safe assuming it was just the same graph that I remember seeing years back.
After users here called out the nonsense text, I just recreated the “meme” from scratch. I grabbed the original screenshot of the graph from Twitter and a stock photo of clouds, and then combined them along with some text so that this is more-or-less the same exact “meme”, just without the AI gibberish.
Pretty disappointed in Lemmy not noticing and downvoting this AI slop.
I’m all for calling out bullshit IoT garbage but zoom in and look closer.
Update: op updated the photo with a non AI image that’s the same but without hallucinated text. The original graph was real and made by a human, but through memes got degraded and an AI upscaler added new hallucinated text to it. Mystery solved and fixed.
I mean, if you zoom in and actually read the text, it very quickly becomes noticeable as fake
Look at the numbers on the scale. Look at the “Downloaid” numbers. Look at the fact that “Syert” is apparently a data unit.
Or how about the fact that something apparently managed to “Uploaid” 97.70 Bytes? Not KB. Not MB. Bytes. You can’t upload .7 bytes, because a byte isn’t divisible by 10. A byte has 8 bits, so it is only measured in eighths. You could upload .625B, or .75B, but not .70B.
On the day that’s between 31\ and 59, the scale that goes from 15poc to 301 000 is making up less Uploaid, of which the total is 53,8B Syert. Both totals are 3.66 GB
It’s been around for several years. It’s probably been passed around so much that the image quality degraded and someone sharpened it with AI which disrupted the text.
I saw this probably 6-7 years ago on reddit, the answer was that the appliance was attempting to download and install an update, then failing the update for some reason, so it was constantly re-downloading the patch all day.
Nothing nefarious or AI slop (other that some crappy image correction) about this.
Interesting. The image seems to have been fixed now, I didn’t know that’s possible. As for your theory, it would then show download traffic, not upload like seen here. I hope the washing machine got fixed too.

Pretty disappointed in Lemmy not noticing and downvoting this AI slop.
I’m all for calling out bullshit IoT garbage but zoom in and look closer.
Update: op updated the photo with a non AI image that’s the same but without hallucinated text. The original graph was real and made by a human, but through memes got degraded and an AI upscaler added new hallucinated text to it. Mystery solved and fixed.
You’re right, but also, why did someone use AI to make this image look worse??
The original is included in this article: https://www.tomshardware.com/networking/your-washing-machine-could-be-sending-37-gb-of-data-a-day
Lovely_reader doing the real investigative journalism here, I love it ☺️
So yes it’s ai slopified, but it is also a real graph that didn’t need to be slopified but was done so using AI upscaling.
So, everyone is right in a way fun twist 😅
Pretty sure I saw a post version of this like a year ago or so, with the font not janky in any way
What makes you think this is AI?
I mean, if you zoom in and actually read the text, it very quickly becomes noticeable as fake

Look at the numbers on the scale. Look at the “Downloaid” numbers. Look at the fact that “Syert” is apparently a data unit.
Or how about the fact that something apparently managed to “Uploaid” 97.70 Bytes? Not KB. Not MB. Bytes. You can’t upload .7 bytes, because a byte isn’t divisible by 10. A byte has 8 bits, so it is only measured in eighths. You could upload .625B, or .75B, but not .70B.
Worst part? The original is super easy to find, and also didn’t need up-scaling at all.
Maybe it’s in Gaelic
On the day that’s between 31\ and 59, the scale that goes from 15poc to 301 000 is making up less Uploaid, of which the total is 53,8B Syert. Both totals are 3.66 GB
It’s been around for several years. It’s probably been passed around so much that the image quality degraded and someone sharpened it with AI which disrupted the text.
I saw this probably 6-7 years ago on reddit, the answer was that the appliance was attempting to download and install an update, then failing the update for some reason, so it was constantly re-downloading the patch all day.
Nothing nefarious or AI slop (other that some crappy image correction) about this.
Interesting. The image seems to have been fixed now, I didn’t know that’s possible. As for your theory, it would then show download traffic, not upload like seen here. I hope the washing machine got fixed too.
My brain hurts
Uploaid and downloaid, and many of the numbers in the chart are in no order
The suggestions that are being used as placeholders for numbers.
For a while, I carefully scrutinized every image for signs of AI
Now, I’ve decided to not bother with a close examination unless it’s important for some reason. There’s not enough time in the day
True however it could be ai upscaling. I seem to remember this post or at least something similar.
I always notice and downvote the ai slop but here I don’t see the patterns?
Also I think I saw this graph from more than a year ago
Edit: op replaced the ai slop graph with the original one so that’s why I didn’t see the garbled text
Shit almost missed it. Thank you.